Home Assistant Energy Dashboard on Apple TV: Monitor Power, Solar and Battery Data.
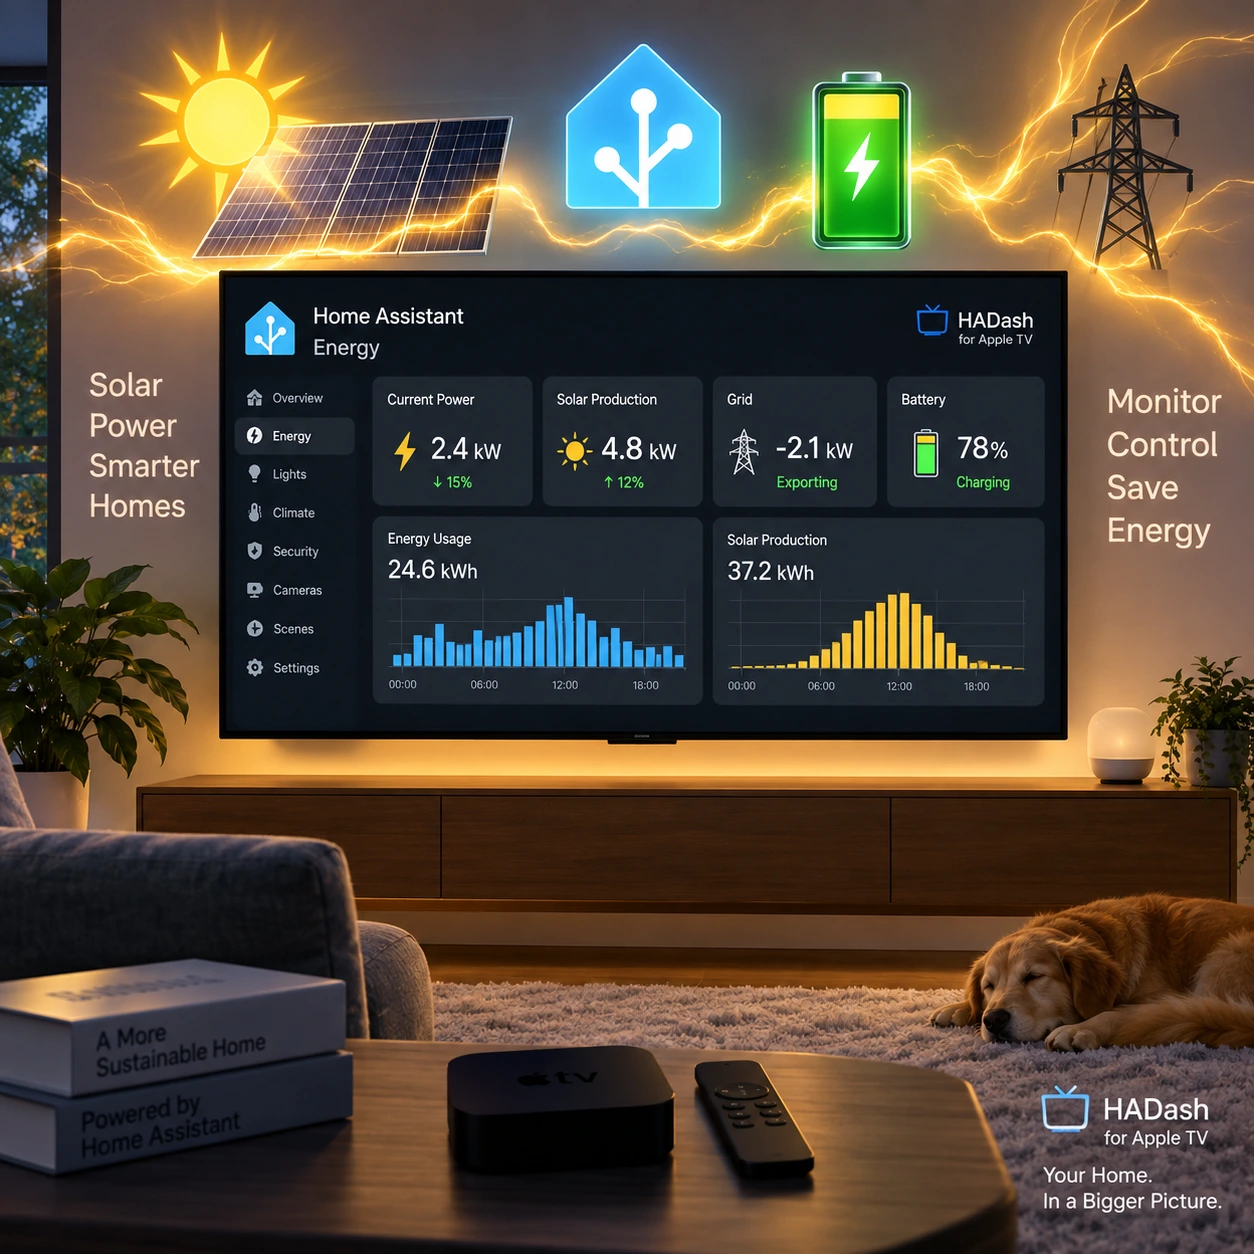
A Home Assistant energy dashboard on Apple TV should make three things easy to check from the couch: how much power the home is using, where that power is coming from, and how much charge remains in the battery.
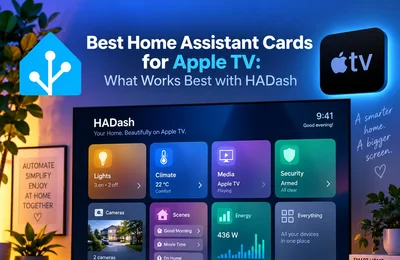
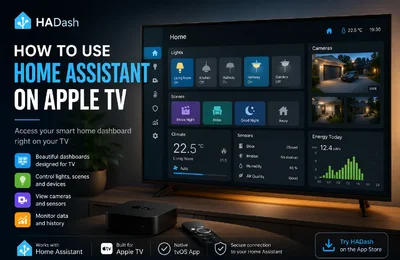
With HADash, you can display these readings using supported Home Assistant cards. A practical starting point is a dedicated dashboard containing current power, solar production, grid import or export, battery charge and today’s energy consumption.
There is one compatibility boundary to understand before building it. HADash supports cards for displaying energy-related entities, but its published compatibility information does not establish support for the complete built-in Home Assistant Energy dashboard. The approach below uses a separate dashboard built around supported cards.
Start with the right measurements: W, kWh and %
Power, energy and battery charge answer different questions. Keeping their units visible prevents a dashboard from showing several plausible numbers that mean very different things.
| Reading | Unit | What it tells you |
|---|---|---|
| Current home power | W or kW | How quickly the home is consuming electricity now |
| Solar power | W or kW | Current output from the solar system |
| Grid import or export power | W or kW | Current electricity flow between the property and the grid |
| Today’s consumption | kWh | Energy used since the start of the day |
| Solar energy today | kWh | Energy generated during the day |
| Battery state of charge | % | Reported battery charge level |
Home Assistant’s energy FAQ explains the distinction between instantaneous power and accumulated energy. For example, a constant 1 kW load running for two hours consumes 2 kWh.
Use explicit card names such as Home Power Now, Solar Power Now and Home Energy Today. A label such as “Consumption” leaves the reader guessing whether the value is an instantaneous reading or a total.
Prepare the data in Home Assistant
HADash displays data from your Home Assistant installation. The meter, inverter, battery integration and any calculations need to work there first.
Identify the entities available for each measurement before designing the television view. Some installations provide separate import and export sensors; others expose a signed net-power sensor. Some provide daily energy totals directly, while others report a cumulative meter reading.
Check the integration’s definitions rather than choosing an entity solely because its name contains “power” or “energy.”
For sensors used in Home Assistant’s Energy configuration, the documented attributes include:
- Energy: device_class: energy with state_class: total or total_increasing.
- Power: device_class: power with state_class: measurement.
- Battery charge: device_class: battery, state_class: measurement and % as the unit.
The Energy troubleshooting guidance also recommends checking supported units and statistics errors when an entity is missing from the selection list.
Home Assistant currently accepts power measurements alongside energy measurements in its Energy dashboard configuration. If your integration supplies only power, an integration helper can calculate accumulated energy from those readings; the result depends on the quality and frequency of the source measurements.
Choose cards according to the question
For this use case, start with Entity, Entities, Sensor, Gauge, History Graph and Statistics Graph cards. HADash lists these among its supported dashboard options, although individual settings can depend on the installed version.
| Information to show | Suggested card | Design decision |
|---|---|---|
| Current home power | Entity or Sensor | Give the value and unit enough space |
| Current solar output | Entity or Sensor | Keep it beside home power for comparison |
| Grid import and export | Entities | Use separate, clearly named rows when available |
| Battery charge | Gauge | Use a 0–100% range |
| Battery charging status | Entity or Entities | Show direction separately from charge level |
| Today’s energy totals | Entities | Display existing daily sensor values |
| Recent power changes | History Graph | Start with a short time window |
| Average or peak power | Statistics Graph | Use supported statistics |
The broader guide to Home Assistant cards for Apple TV covers their general use. For an energy screen, the more important decision is which measurement each card represents.
Use gauges where the range means something
Battery state of charge is a straightforward gauge because its percentage has a defined scale.
A power gauge needs more thought. Choose a range appropriate to the measurement and the equipment being monitored. Avoid arbitrary red zones that imply an electrical limit or tariff threshold you have not verified.
For solar production, a plain numeric card may be clearer than a gauge when the household only needs to know the current output. Reserve colour thresholds for values that have an understood meaning.
Build the first screen around current conditions
Start with this proposed arrangement, then adjust it on the television:
| Screen area | Content |
|---|---|
| Upper left | Home Power Now |
| Upper centre | Solar Power Now |
| Upper right | Battery Charge |
| Middle | Grid import/export and battery charging/discharging |
| Lower area | Today’s energy totals and one recent-power graph |
This is a visual layout recommendation, not a requirement to use a particular Grid card. Arrange supported cards in your Home Assistant dashboard and check how the installed HADash version displays them.
Keep the top readings visible without scrolling. Use short names, persistent units and enough contrast to read the values from the normal seating position. If the first view becomes crowded, move the graph to a second view before shrinking every card.
For a home without solar or battery storage, remove those panels. A useful starting screen can contain just current home power, today’s consumption and a recent history graph.
Show solar, grid and battery as separate readings
Solar production alone does not tell you whether spare power is available. The home may be consuming it, the battery may be charging, or electricity may be flowing to the grid.
Place the relevant readings together:
- Solar Power Now
- Home Power Now
- Grid Import / Export
- Battery Charging / Discharging
If your integration exposes one signed grid sensor, verify what positive and negative values mean. A negative number without a direction label is difficult to interpret from across the room.
Use the same care with battery power. Charging and discharging conventions can differ between integrations. Label the direction according to the source documentation and confirm it against a known operating state.
Home Assistant’s grid integration guide describes configuring imported and exported energy separately. Preserve that distinction in daily totals too: Grid Import Today and Grid Export Today are more informative than a single unexplained “Grid” value.
Battery percentage needs operating context
A battery at 70% might be charging, discharging or idle. Pair its charge gauge with the relevant status or power entity when the integration provides one.
Avoid estimating runtime from percentage alone. A useful runtime estimate would also need usable capacity, current demand and the system’s operating constraints. If the battery integration already supplies an estimate, label it as an estimate and keep the reported unit visible.
Make “Today’s Consumption” a real daily value
A cumulative energy meter may report the total recorded over months or years. Renaming that entity “Today’s Consumption” does not make it a daily measurement.
If your integration already provides a reliable daily total, display it directly. Otherwise, Home Assistant’s Utility Meter helper can track a source energy sensor over a configured daily cycle.
A practical workflow is:
- Choose the cumulative energy sensor for the measurement you need.
- Create a Utility Meter helper with a daily reset cycle.
- Give the resulting entity an explicit name.
- Add it to an Entity or Entities card.
- Check its behaviour after the next daily reset.
Home Assistant notes that the first cycle is incomplete. A daily meter created during the afternoon will not reconstruct the morning’s consumption automatically.
Also distinguish Home Energy Today from Grid Import Today. In a solar or battery installation, electricity imported from the grid is only one possible source of the home’s energy.
History Graph or Statistics Graph?
Use a History Graph to inspect recent changes: when household demand rose, when solar output fell, or when the battery started discharging.
For the television, begin with a proposed window of three to six hours and a small number of series. Keep power readings in the same unit and put battery percentage in a separate graph.
Home Assistant warns that long ranges with many state changes can delay rendering in its History Graph documentation. Start small and expand the range only when it answers a useful question.
HADash’s release history records History Graph support and fullscreen history viewing. This can help when a compact graph is too small to inspect from the couch.
Use statistics for averages and peaks
A Statistics Graph answers questions such as “How did average home power change?” or “What was the maximum reported power during this period?”
Home Assistant’s Statistics Graph card supports several statistical types. HADash’s published compatibility notes specifically list minimum, maximum and mean.
That distinction matters for energy totals. Averaging a cumulative kWh counter does not calculate consumption for the day. Use a daily energy entity for the headline total, and do not assume that Home Assistant’s sum or change graph modes work in HADash.
The HADash compatibility matrix and release history also list Energy Distribution Card as planned. Check future updates before building a television view that depends on it.
Keep detailed energy analysis in Home Assistant
Use the Apple TV view for current conditions and a small set of daily totals. Keep detailed date comparisons, costs, source breakdowns and configuration work in the Home Assistant interface where those features are available.
This division gives each screen a clear purpose. Someone passing through the living room can check the current load or battery charge. Someone investigating a week of electricity use can open the detailed Energy dashboard and inspect the relevant period.
A custom energy-flow card that works in a browser should be checked separately for HADash compatibility. Support for its underlying sensors does not establish support for the card’s interface.
Open the dashboard in HADash and verify it
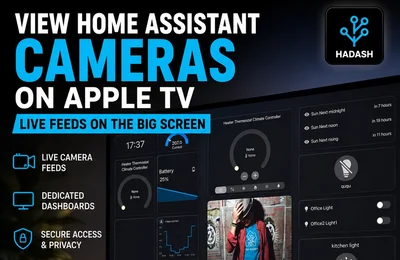
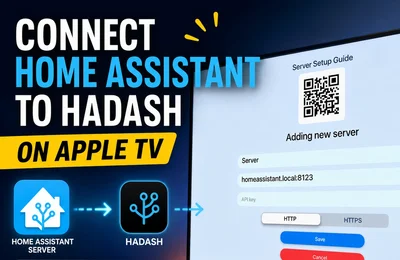
Create and edit the dashboard in Home Assistant, then open it through HADash on Apple TV. If the server is not connected yet, follow the HADash connection guide.
Compare the television readings with the same entities in Home Assistant. Check units, direction labels, daily totals and graph availability.
An unavailable sensor should remain visibly unavailable. Substituting zero can make a disconnected inverter look like zero solar production or an offline meter look like zero consumption.
Update frequency also matters. A display can only reflect the readings supplied by the integration. If a number seems delayed, first compare it with the source entity in Home Assistant before treating it as a television rendering problem.
Finally, sit at the normal viewing distance and use the Siri Remote. Confirm that you can identify current home power, grid direction and battery charge without opening another card. Move anything that requires prolonged inspection to the detailed view.