Home Assistant Climate Dashboard on Apple TV: Temperature, Humidity and Thermostat Control
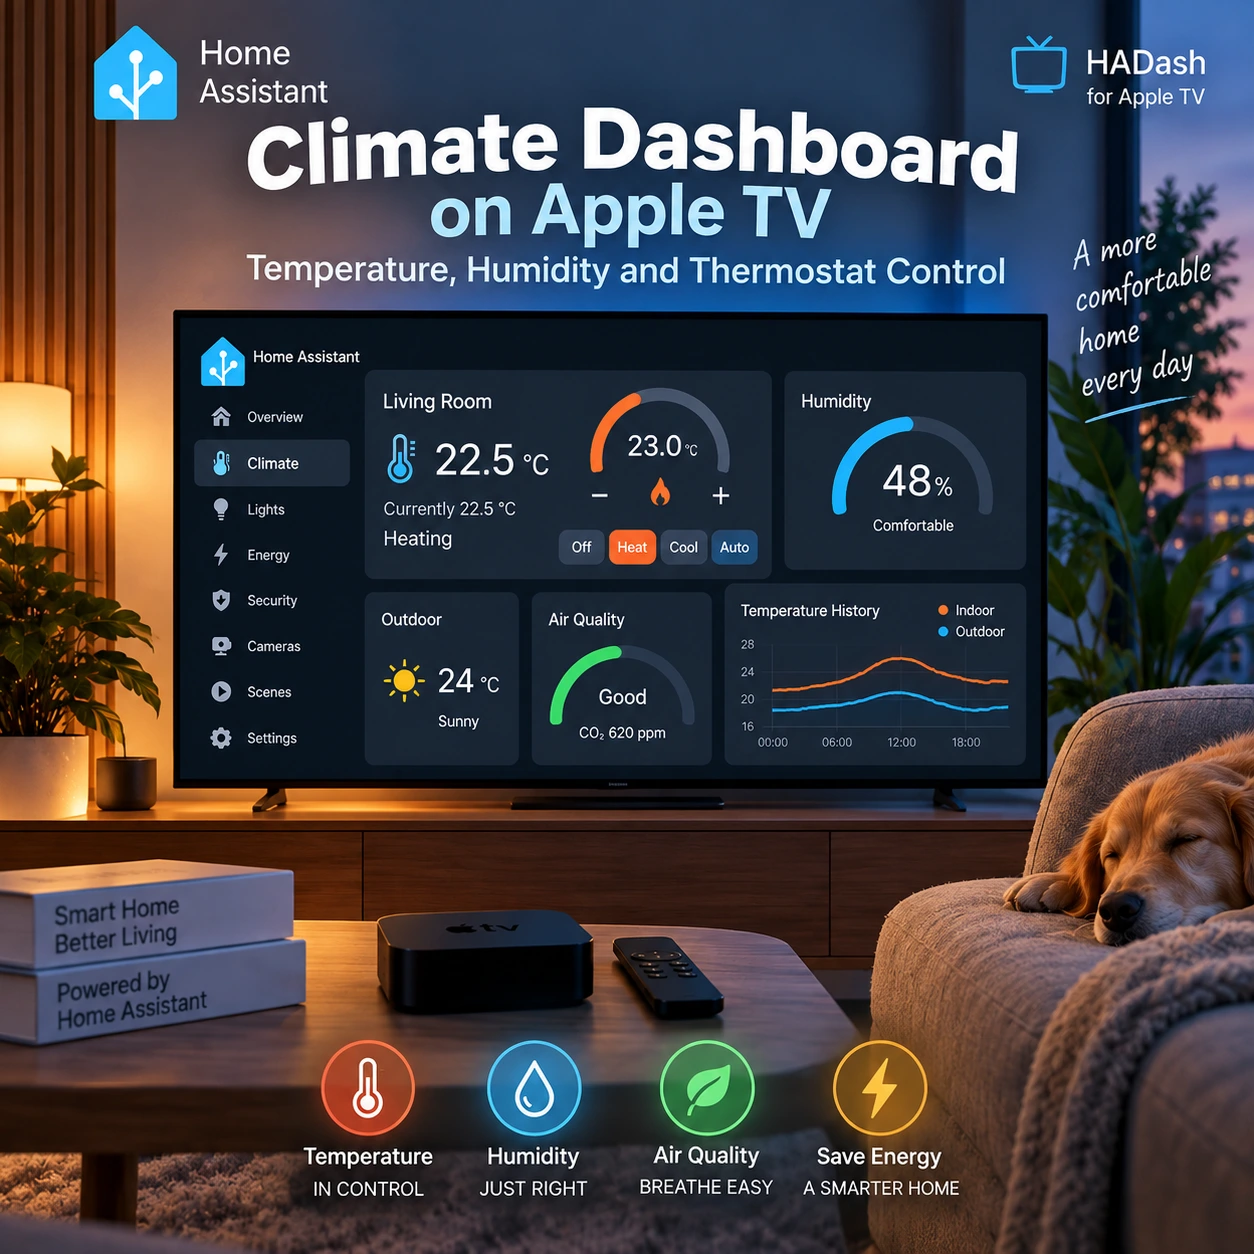
A climate dashboard on the living-room TV should let everyone check the room temperature, see what the heating or cooling system is doing and reach a few everyday controls. Detailed schedules and equipment configuration can stay on a phone or computer.
HADash connects Apple TV to your existing Home Assistant installation and displays supported dashboard cards. You build the interface in Home Assistant Dashboards; the HADash public repository documents connection requirements, card support and release changes.
The practical task is choosing what belongs on the television—not copying every climate entity onto a larger screen.
Quick Answer
A good Apple TV climate dashboard should show current temperature, target temperature, HVAC state, humidity, outdoor conditions and only the most useful available air-quality measurements. Use a Thermostat Card for supported controls, Sensor Cards for current measurements, and History Graph or Statistics Graph cards for trends. Keep a small climate summary on the Home view and put room details in a dedicated Climate view. HADash supports these card types, subject to its version and configuration limitations. For Apple TV, climate overview is usually more useful than exposing every thermostat setting; fine adjustments and schedules are better handled on a touchscreen or desktop.
What Should a Climate Dashboard Show?
Choose each item according to a question someone in the household needs answered.
| Information | Question it answers | Suggested priority |
|---|---|---|
| Current temperature | How warm is this room now? | Main overview |
| Target temperature | What temperature is requested? | Main overview |
| HVAC mode | Is the system configured for heating, cooling or another mode? | Main overview |
| Heating/cooling activity | Is the equipment actively heating, cooling or idle? | Main overview, if reported |
| Humidity | What is the room’s relative humidity? | Climate view |
| Outdoor temperature | What are conditions outside? | Compact outdoor section |
| CO₂ or other air measurements | What does the installed sensor report? | Include selectively |
| Fan mode | What fan setting is selected? | Only when useful |
| Window state | Is a monitored window open? | Beside the relevant room |
| Temperature history | How has the reading changed? | One large graph |
HVAC mode and HVAC activity are different. A thermostat set to Heat may be idle because its target has been reached. Home Assistant distinguishes the selected mode from the optional hvac_action attribute. Available states and actions depend on the device and integration, as described in the Climate documentation.
Also distinguish a separate room sensor from the temperature measured by the thermostat. Label both clearly if you display both; do not assume the thermostat uses the separate sensor for control.
Thermostat Card: Control Without a Wall of Settings
Home Assistant’s Thermostat Card works with climate entities and supports temperature and mode changes. The available controls depend on what the underlying entity exposes.
HADash lists Thermostat Card support. That establishes a starting point for thermostat control on Apple TV, not a promise that every optional Home Assistant card feature or manufacturer-specific setting works identically.
Start with one thermostat for the room where the TV is located. Make the current reading and requested target easy to distinguish. For a system using a heating/cooling range, preserve the two target limits rather than presenting them as one setpoint.
Test a small, appropriate adjustment with the Siri Remote, then confirm the updated target in Home Assistant. Check whether the change interacts with a schedule or preset. A dashboard command should not be assumed to override every automation indefinitely.
If an important control requires several nested menus or awkward remote gestures, keep it in the mobile interface. Put only the controls that work clearly in your tested configuration on the shared screen.
Sensor Cards for Temperature and Humidity
The Sensor Card displays a sensor’s current state and can include a graph. Use it for measurements rather than as a substitute for thermostat controls.
Useful candidates include:
- Living Room Temperature.
- Bedroom Temperature.
- Outdoor Temperature.
- Living Room Humidity.
- Office CO₂.
- A numerical air-quality measurement exposed by your installation.
Keep labels short, but retain the room and unit. “Office CO₂” is more useful than “Air,” while “Temperature” becomes ambiguous when indoor and outdoor readings sit together.
Not every climate value is a standalone sensor. A thermostat target or operating activity may be an attribute of a climate entity. Check how the value is exposed before choosing a card; do not expect a Sensor Card to extract every attribute automatically.
For text states, such as a reported air-quality category, consider an appropriate supported Entity or Entities Card. The broader guide to Home Assistant cards for Apple TV compares the available building blocks.
Gauge Cards for Selected Climate Metrics
A Gauge Card places a numerical value on a configured scale. It can be useful for humidity, CO₂, an air-quality index or heating demand when your integration supplies that measurement.
Use one or two gauges to emphasize readings that deserve attention. A separate dial for every sensor consumes space without necessarily making the dashboard easier to interpret.
Set the minimum, maximum and units to match the measurement. A percentage scale is not appropriate for a CO₂ value in ppm. Likewise, heating demand is not automatically a percentage unless the source defines it that way.
Color bands are configuration choices, not independent health assessments. Base any thresholds on the specific metric and an appropriate source.
Battery level can belong in a maintenance view. On the main climate screen, consider showing a low-battery exception rather than a permanent gauge for every sensor.
History Graph and Statistics Graph: Two Different Jobs
Use history to inspect changes over time and statistics to compare summarized trends. Neither should replace the current value when someone wants to know the room’s condition now.
History Graph for recent changes
The History Graph Card can display recorded entity history. Practical climate uses include:
- Room temperature over the last day.
- Humidity changes during the evening.
- CO₂ changes during room occupancy.
- HVAC activity, if that activity is available as a recorded entity.
Do not assume every climate attribute appears as its own historical series. Verify the source and recorded data in Home Assistant first.
For TV, give the graph enough width to read its time axis and distinguish its lines from the sofa. Keep temperature and humidity in separate charts unless the presentation makes their different units unambiguous.
Statistics Graph for broader trends
The Statistics Graph Card requires suitable statistics data. A current sensor reading alone does not establish that the sensor has the necessary statistics.
For eligible temperature sensors, minimum, maximum and mean values can help compare daily conditions. HADash’s published support matrix limits Statistics Graph types to min, max and mean; do not assume support for every option available in Home Assistant.
There is a documentation discrepancy worth noting: the HADash README’s older matrix labels History Graph as planned, but its later release notes record its addition, and the current website lists it as supported. Check your installed version and test the actual graph.
A Practical Climate Dashboard Layout for Apple TV
Organize the view by task rather than by device manufacturer.
Climate Overview
Place the main thermostat and a small set of status readings at the top:
- Current temperature.
- Target temperature or target range.
- HVAC mode and reported activity.
- Room humidity.
- Outdoor temperature.
Air
Group CO₂ and selected air-quality measurements beneath their room name. Omit this section if your installation does not expose useful air sensors.
History
Use a wide temperature graph, followed by a humidity graph if it answers a separate question. Avoid squeezing both into tiny cards just to fit them above the fold.
Actions
Put a short row of tested presets or scripts near the main control area. Use a consistent position so household members do not have to search for the same action.
These are layout recommendations, not requirements to use a particular Grid Card. Arrange supported cards in a view layout that renders correctly in your HADash version.
Main Home View vs Dedicated Climate View
The Home view should provide enough information to decide whether to open Climate.
A compact summary might contain current temperature, target temperature and a clear operating state. It does not need every room’s humidity, fan settings and historical charts.
The dedicated Climate view can hold the thermostat, room comparisons, outdoor context, air sensors and history. This separation keeps climate useful without crowding out lights, cameras and other household information.
The living-room dashboard guide explains that broader division of tasks.
Create or edit the view in Home Assistant, then test it on the television. Do not judge readability solely from the dashboard editor on a laptop.
Multi-Room Climate Dashboards
For Living Room, Bedroom, Kitchen and Office, use compact room summaries with the same field order.
For example:
Living Room: temperature, humidity, heating activity.Bedroom: temperature, humidity, window state.Kitchen: temperature, humidity.Office: temperature, CO₂.
Only include measurements actually available in each room. A missing sensor should not become a fabricated value or a copied reading from another room.
Avoid four full thermostat interfaces on one screen. Start with summaries, then place detailed controls in room-specific views where needed.
When comparing rooms, check that the values are current and that the sensors represent the locations implied by their labels. Treat an unavailable reading as unavailable, not as zero or the last known comfortable condition.
Outdoor vs Indoor Climate Data
Keep outdoor information in a separate row or section. This prevents someone mistaking an outdoor temperature for the room temperature or comparing unrelated air-quality readings.
Indoors, prioritize temperature, humidity and whichever air measurements you actually monitor. Outdoors, a temperature reading, humidity and weather condition may provide enough context.
Label the source when it matters: “Patio Temperature” and “Weather Service Temperature” describe different data origins. A forecast is also different from a current measurement.
Do not infer that opening a window is always the appropriate response from an indoor/outdoor temperature comparison alone. The dashboard supplies context; it does not know every relevant condition or household constraint.
Windows and Climate: Put Related States Together
Show a room’s window sensor near its heating or cooling status. This makes the relationship visible without requiring a separate security view.
An illustrative display could read:
- Living Room — 22.5°C.
- HVAC mode — Heat.
- HVAC activity — Heating.
- Window — Open.
This is a prompt to check the situation, not proof of a quantified energy loss. The household may be airing the room deliberately, or the equipment may be transitioning between states.
Displaying the window status does not create an automatic heating interlock. If you want heating to react to windows, configure and test that automation separately, with behavior appropriate to your equipment.
For consumption rather than operating status, use the separate Home Assistant Energy Dashboard on Apple TV guide. A thermostat reporting Heating is not itself an electricity or fuel meter.
Air Quality and CO₂: Show the Measurement You Have
If your Home Assistant installation exposes these sensors, you can include CO₂, PM2.5, VOC readings or an air-quality index. Do not build an “Air Quality” panel that implies all of them are available.
Preserve the identity of each metric:
- Show CO₂ with the unit supplied by the sensor.
- Identify particulate measurements such as PM2.5 separately.
- Keep the manufacturer’s VOC metric and unit visible.
- Name the source or scale of an AQI reading.
- Present humidity as humidity, not as an overall air-quality score.
Avoid turning one reading into a universal “safe air” indicator. A reported “Good” category should be identified as the source’s category, not your dashboard’s medical conclusion.
Choose one room’s important air measurements first. Add more only when someone can explain what decision the extra card supports. Keep detailed thresholds and sensor calibration work off the shared TV interface.
Climate Scenes and Presets
An action named Night can be easier to use with a remote than adjusting several rooms individually.
Possible action labels include Comfort, Eco, Away, Night, Preheat and Cool Down. These are examples—not built-in HADash presets or modes guaranteed to exist on your thermostat.
In Home Assistant, a scene can apply predefined entity states, while a script can run a sequence of actions. A thermostat’s own preset mode is a separate device capability.
Configure the intended behavior in Home Assistant first. Then expose a supported action through your TV dashboard and test it in HADash.
Check what happens afterward: does the device remain at that setting, resume a schedule or get changed by another automation? Name the button according to its actual effect. “Preheat” without an understood target and stopping behavior is too ambiguous for shared use.
The lights and scenes guide covers the broader approach to household actions.
Designing Climate Controls for Siri Remote
Test the dashboard from the seating position with the actual remote.
Try four tasks: read the temperature, identify whether heating is active, adjust the target and return to Home. Count unnecessary navigation steps and remove obstacles.
Prefer:
- Large, readable cards.
- Short room and action labels.
- Clear visual focus.
- A predictable order of controls.
- Limited scrolling.
- Few sliders and nested menus.
Do not put a frequently used thermostat control beyond several screens of graphs. Avoid making color the only way to distinguish Heating from Idle; retain a readable state label.
The remote-friendly dashboard guide develops these navigation principles. For frequent detailed interaction, compare the roles of Apple TV and a tablet instead of forcing every task onto the remote.
What Not to Put on the TV Dashboard
Keep an administrative climate view elsewhere for:
- HVAC diagnostics and integration debug information.
- Raw entity attributes.
- Calibration values.
- Detailed battery telemetry.
- Complex schedules.
- Equipment-specific maintenance settings.
A useful exception is a simple maintenance warning. “Bedroom Sensor: Battery Low” may deserve attention even though the full battery history does not.
Do not hide important faults merely to make the screen look clean. Distinguish household-relevant problems from technical details that only the administrator needs.
Example Climate Dashboard Blueprint
The following is an illustrative layout, not a live household reading or a set of recommended temperature and air-quality targets.
| Section | Example content | Presentation |
|---|---|---|
| Overview | Living Room 22.5°C; Target 23°C; Mode Heat; Activity Heating; Humidity 48% | Thermostat plus concise readings |
| Air | Office CO₂ 620 ppm; Air Quality “Good,” as reported by the selected source | Sensor or Entity cards |
| Outdoor | Temperature 24°C | Clearly labeled outdoor reading |
| History | 24-hour room temperature; humidity history | Separate wide graphs |
| Actions | Comfort, Eco, Away, Night | Tested household actions |
Before relying on the layout, check that each displayed value comes from the intended entity. Confirm that “Heating” reflects actual reported activity rather than merely the selected Heat mode.
Test the action buttons individually and watch for the resulting state change. Then temporarily inspect how the interface presents an unavailable sensor. A missing reading should remain visibly different from a normal one.
Start with this arrangement for one room. Expand only after the main controls are easy to reach and the measurements remain readable from the sofa.
Common Mistakes
- Showing every sensor. Keep only readings that support a household decision.
- Using tiny cards. Test from the sofa, not just beside the television.
- Adding too many gauges. Reserve them for selected numerical measurements.
- Putting every room’s thermostat on one screen. Use summaries and separate detailed views.
- Overusing sliders. Prefer clearly tested controls and meaningful presets.
- Leaving technical entity names visible. Use room names and understandable labels.
- Mixing diagnostics with household controls. Separate administration from everyday use.
- Skipping a dedicated Climate view. Do not let secondary graphs overwhelm Home.
- Confusing mode with activity. Heat and Heating do not mean the same thing.
- Assuming browser compatibility means HADash compatibility. Verify the card and the required interaction on Apple TV.
FAQ
Can I control a Home Assistant thermostat from Apple TV?
Does HADash support Thermostat Card?
Can I show temperature and humidity on Apple TV?
Can I show CO₂ and air quality?
Should climate controls be on the Home screen?
Can I show temperature history?
Is Apple TV good for detailed HVAC control?
Can I create a separate Climate dashboard?
HADash brings supported Home Assistant dashboards to Apple TV for shared climate, lighting, camera and household information. Check the current compatibility notes and setup instructions, then test one thermostat, a few measurements and one graph before expanding your Climate view.